
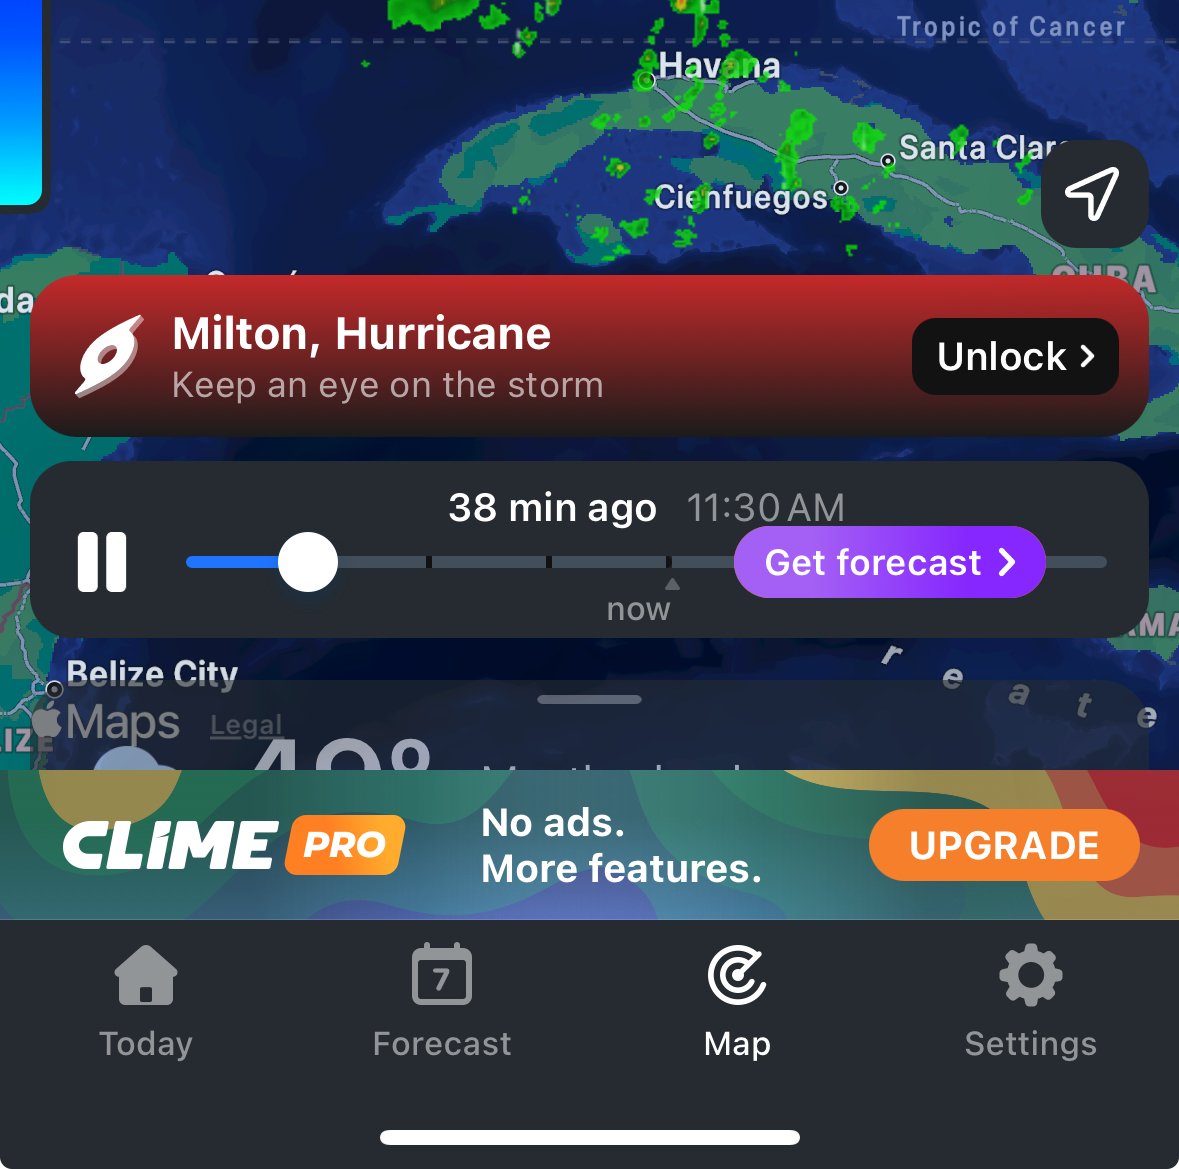
The app is Clime Pro on iOS, they lock full access to Hurricane Milton data behind a $10 USD per week paywall.
If you’re in the area impacted by Milton, you can find publicly available resources at the National Hurricane Center’s website: National Hurricane Center
There is nothing more tech-bro libertarian than taking free public data, wrapping it in a slick package, and selling it.
I used to think that TV weather people were obsolete, but now I’m nostalgic for the public service that survived in the old capitalistic ad based broadcast TV era.
To be fair, free broadcast tv and radio is still a thing, and they are an integral part of the US’s disaster alert system. With the right equipment (read: basic cheap radio available almost everywhere), you can still listen to weather information (both general and severe) directly from the horse’s mouth 24/7 for free.
In a disaster situation, these services will still stand because they require less infrastructure per person reached than is required to deliver high-speed internet to the same number of people.
These services still exist, and will continue to, but the knowledge of them has atrophyed from disuse. They won’t go away, they’ve just been replaced in general usage because of the convenience that the internet provides us.
TL;DR: Get you a weather radio, get free weather for the life of the equipment. Even if it’s not your daily driver, get one anyways, because you’ll be able to hear the most relevant info in the worst situation.
I have a weather radio. Every time I turn it on during an intense storm, it gives me very little useful information. It tells me something like “a tornado has been sited in your area [without defining what that means], seek shelter immediately.” After the last massive storm ended where so many fallen trees destroyed homes, took out power lines, made roads impassable, etc. and the cell network was getting jammed by so many users, do you know what information the two local TV stations and the local radio stations were offering?
Fuck. All.
But hey, one of the two TV stations did relay the fact that the state had made a disaster declaration half a day after the declaration was made.
Those services exist, but they’re almost useless.
But muh free market!
In a hypothetical world where everyone has every comfort available and every need met,
in that world at least,
I could say:
“There is some room for wrapping something in a sleek package!“
(Maybe I’d pay a dollar if someone remade those graphs really beautifully)
I only ever check my weather on NWS, but a year or two ago they went from having easily read hourly forecast data to those obnoxious graphs. I have zero clue why they did that.
If you click on the graph, it’ll turn into a data table showing ~48 hours worth of information. Is that what you’re looking for?
Holy shit, you’re awesome! Seriously, thank you haha, that makes readability so much faster.
Meteorologists do those graphs. What do you expect. Having set through more than one lecture by NOAA person for certification as a weather watch person as a firefighter. They love graphs and photos of clouds. Sooooo many photos of clouds…
Still, they are easy enough to read once you get used to them.
Oh for sure, I get that. But the NWS website is still meant for the public to use, and the old design layout was simpler and faster to read. Some folks might read graphs faster/as fast, but not for many of us. Regardless, another user pointed out you can click on the graph and it converts it all into an easy to read table format. :)
Even AccuWeather is saying they’re going too far now.
https://www.masslive.com/news/2024/07/accuweather-rejects-project-2025s-national-weather-service-noaa-plans.html
They realize they need that government data too.
AccuWeather’s business model relies on “adding value” to government-provided data, and monetizing it. Maintaining a fleet of satellites isn’t cheap.